Monday, March 21, 2011

Assignment 2

  • Here's the link to the second assignment: PDF file 
Introduction
For this assignment, to cut down on the number of images I made videos using matlab avi command. See the last post to see how this was made.

Original Images:
These were the same images from Assignment 1. In total there are 51 files.

 Color Edge Histograms
This ran all of the original images through the color edge algorithm. There's a known issue with images 4021-4051, where it appears that it generates the same color edge histogram for these images. I've checked the algorithm and it seems correct and it seems to generate a correct value for the first 20 or so images. 
Color Edge Histogram
Segmentation
Histogram Intersection

For these results, a threshold value of 80 was chosen, after it was seen that most similar images were above 80.
Segment 1
 
Segment 2


Segment 3


Segment 4


Chi-Squared Measure:
 For these values, the threshold that was chosen was 600. It was observed that this equation was generating very large values, above 1000, so the values were scaled down by 1000. It was then observed that values <600 typically corresponded to similar images.
Segment 1

Segment 2


Segment 3


Segment 4


Segment 5 

Matlab Script to Create an AVI Movie

The following is a script a wrote to create a movie with matlab, at a given fps:

function [aviobj]=imageMovie(mydir,filename,fps)
allImages = dir([mydir '/*.jpg']);
aviobj=avifile([mydir '/' filename],'fps',fps);
for i=1:length(allImages)
M(i)=im2frame(imread(allImages(i).name));
end;
aviobj = addframe(aviobj,M);
aviobj = close(aviobj);

Tuesday, February 22, 2011

Assignment 1

This is my submission for Assignment 1. The full write up and complete results will be submitted to the professor directly. I'll post the full results once they've been graded and such.


Assignment Requirements

The requirements: PDF

Part 1: The original images

The following are the images, before any sort of manipulation.


Part 2: Edge Detection

For this, the professor gave us some simple matlab code. The basic algorithm is as follows:
  1. Smooth the image, using a Binomial estimation of a Gaussian filter. 
  2. Calculate the gradient of the image.  This will generate a magnitude and a direction of the gradient at each pixel. 
  3. Apply a nonmaxima suppression step to thin the
    edges to single pixel wide edges
  4. Run Hysteresis threshold.


Histogram

The last step was to generate a histogram for each image. Essentially this is a count of all of the colors in the image. To process, I performed the following steps:
  1.  On the red channel, I shift the bits to the right 4, and then to the left 8. (Roughly equivalent to dividing by 16 and then multiplying by 256)
  2. On the green channel, I shifted thebits to the right 4. (Roughly equivalent to dividing by 16).
  3. On the blue channel, I shifted the bits to the right 4, and then to the left 4. (Roughly equivalent to dividing by 16).
  4. Sum the result of all of the bit shifts above (red+blue+green).  All values of the pixels will be between 0-4095. 
  5. Plot the counts. 


Thursday, January 27, 2011

Playing Around With Matlab

For the first class, the professor walked us through some basic image manipulation using matlab. I won't post the specifics, in terms of what I did for each manipulation, but I will post the end result.


First here's the original image. Basically I just took a jpg I took with a digital camera. In this case it's an image of the Nationals Scoreboard in Washington, DC.
Original Image
Next I converted the image to a .gif. In matlab I loaded the image as the image and the color map. Next I opened up the image without the color map. The following is just an image with the different color extremes.
Image with color map extracted
With the color map extracted I generated a new gray scale color map and applied it to the image. The following is the result of the image with a gray scale color map applied.
Image with gray color map
Next I created a red scale color map and applied it to the image
Image with red color map
Now we take a green color map and apply it
Image with green color map
Now the image has a blue color map applied to it
Image with blue color map

Next time: Adding two images together

How to Connect to Matlab on the Mason Server

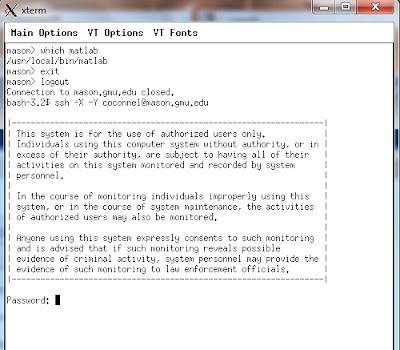
For this course, we'll need to use the tool Mat Lab to manipulate the images. Matlab can be purchased from the GMU bookstore for $99, (at the student rate). In addition all of the servers on mason have it installed. As long as you run a ssh session with the -X -Y flags added, you can run Matlab remotely. Please note, only George Mason University students can do this. Also the following was done on Windows 7.
  1. Obtain access to the mason server.  Go to http://mason.gmu.edu/ and follow the instructions to set up an account. 
  2. Download Cygwin and Cygwin-X: Go to http://x.cygwin.com/ and download cygwin and cygwin x. 
  3. SSH into the mason server: Open up XWinServer. Right-click on the server and open up a ssh session.

    Log in with your password.
  4. Run Matlab: It may take a few minutes, depending on connection and such:

  5. Start Using Matlab